

Children’s apparel manufacturer Carter’s (NYSE:CRI) reported revenue ahead of Wall Street’s expectations in Q1 CY2025, but sales fell by 4.8% year on year to $629.8 million. Its non-GAAP profit of $0.66 per share was 27.9% above analysts’ consensus estimates.
Is now the time to buy Carter's? Find out by accessing our full research report, it’s free.
Carter's (CRI) Q1 CY2025 Highlights:
- Company suspends forward guidance in light of CEO transition and tariff uncertainty
- Revenue: $629.8 million vs analyst estimates of $623.9 million (4.8% year-on-year decline, 0.9% beat)
- Adjusted EPS: $0.66 vs analyst estimates of $0.52 (27.9% beat)
- Adjusted EBITDA: $48.6 million vs analyst estimates of $47.73 million (7.7% margin, 1.8% beat)
- Operating Margin: 4.1%, down from 8.3% in the same quarter last year
- Free Cash Flow was -$58.99 million compared to -$37.57 million in the same quarter last year
- Same-Store Sales fell 5.2% year on year (-6.8% in the same quarter last year)
- Market Capitalization: $1.39 billion
“I am very proud to join Carter’s as its new CEO,” said Douglas C. Palladini, Chief Executive Officer & President.
Company Overview
Rumored to sell more than 10 products for every child born in the United States, Carter's (NYSE:CRI) is an American designer and marketer of children's apparel.
Apparel and Accessories
Thanks to social media and the internet, not only are styles changing more frequently today than in decades past but also consumers are shifting the way they buy their goods, favoring omnichannel and e-commerce experiences. Some apparel and accessories companies have made concerted efforts to adapt while those who are slower to move may fall behind.
Sales Growth
Examining a company’s long-term performance can provide clues about its quality. Any business can put up a good quarter or two, but many enduring ones grow for years. Carter’s demand was weak over the last five years as its sales fell at a 3.9% annual rate. This wasn’t a great result and suggests it’s a low quality business.
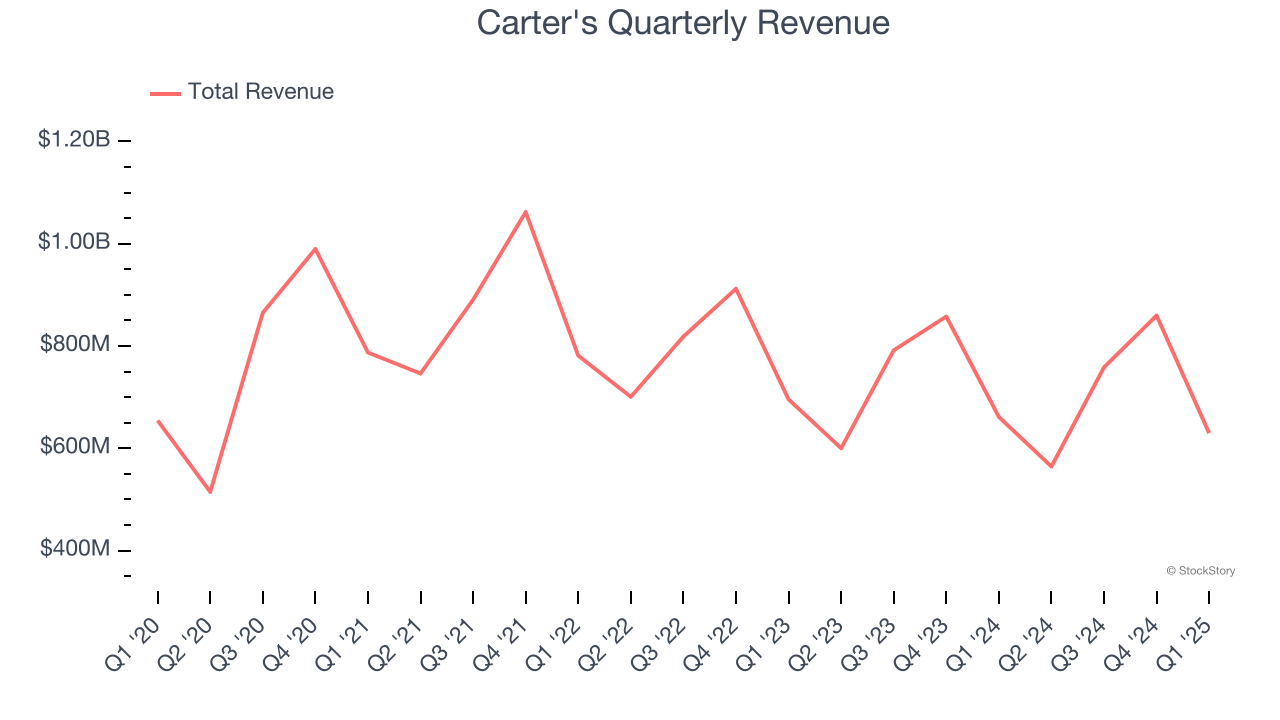
We at StockStory place the most emphasis on long-term growth, but within consumer discretionary, a stretched historical view may miss a company riding a successful new product or trend. Carter’s recent performance shows its demand remained suppressed as its revenue has declined by 5.2% annually over the last two years. 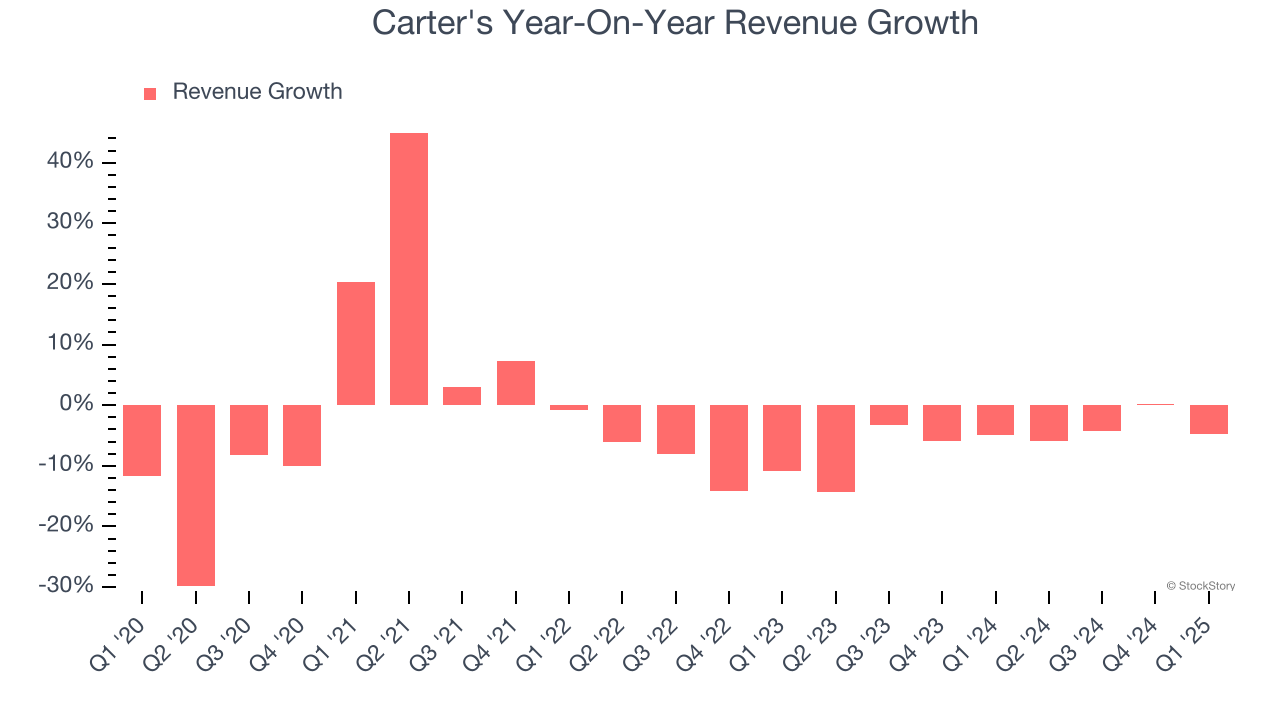
Carter's also reports same-store sales, which show how much revenue its established locations generate. Over the last two years, Carter’s same-store sales averaged 8.9% year-on-year declines. Because this number is lower than its revenue growth, we can see the opening of new locations is boosting the company’s top-line performance. 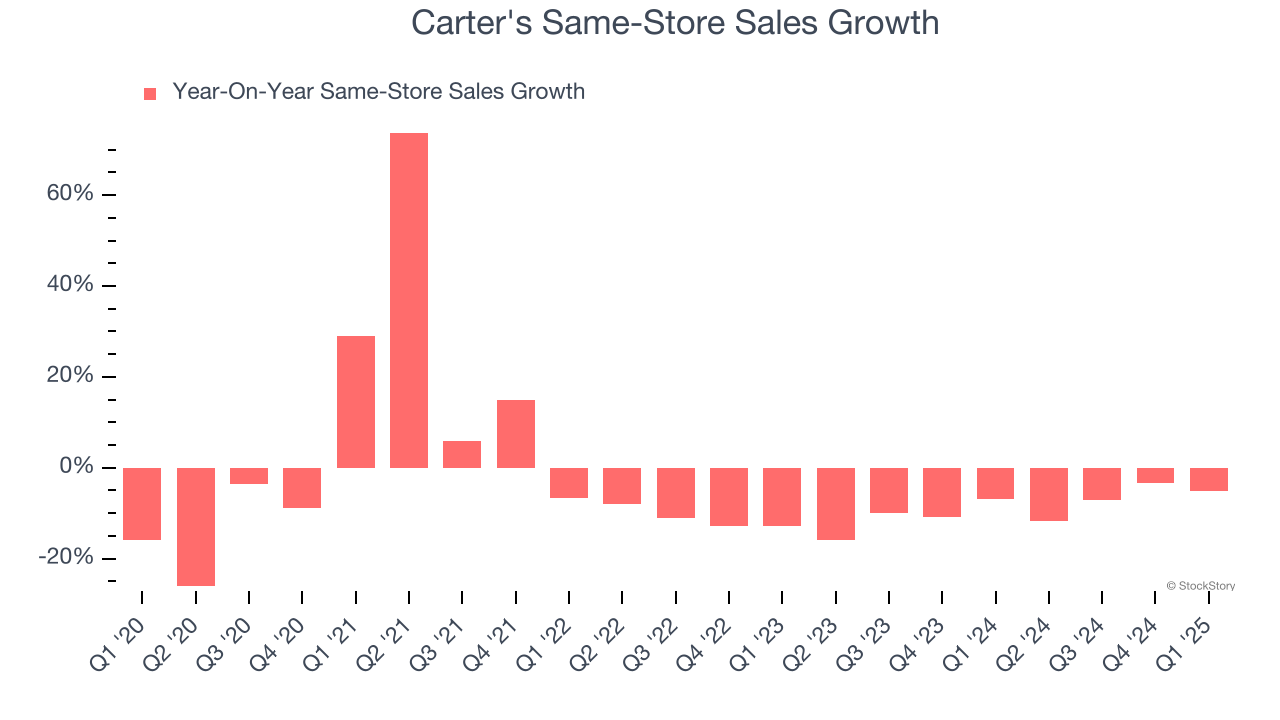
This quarter, Carter’s revenue fell by 4.8% year on year to $629.8 million but beat Wall Street’s estimates by 0.9%.
Looking ahead, sell-side analysts expect revenue to remain flat over the next 12 months. Although this projection indicates its newer products and services will catalyze better top-line performance, it is still below the sector average.
Here at StockStory, we certainly understand the potential of thematic investing. Diverse winners from Microsoft (MSFT) to Alphabet (GOOG), Coca-Cola (KO) to Monster Beverage (MNST) could all have been identified as promising growth stories with a megatrend driving the growth. So, in that spirit, we’ve identified a relatively under-the-radar profitable growth stock benefiting from the rise of AI, available to you FREE via this link.
Operating Margin
Carter’s operating margin has shrunk over the last 12 months and averaged 9.6% over the last two years. The company’s profitability was mediocre for a consumer discretionary business and shows it couldn’t pass its higher operating expenses onto its customers.
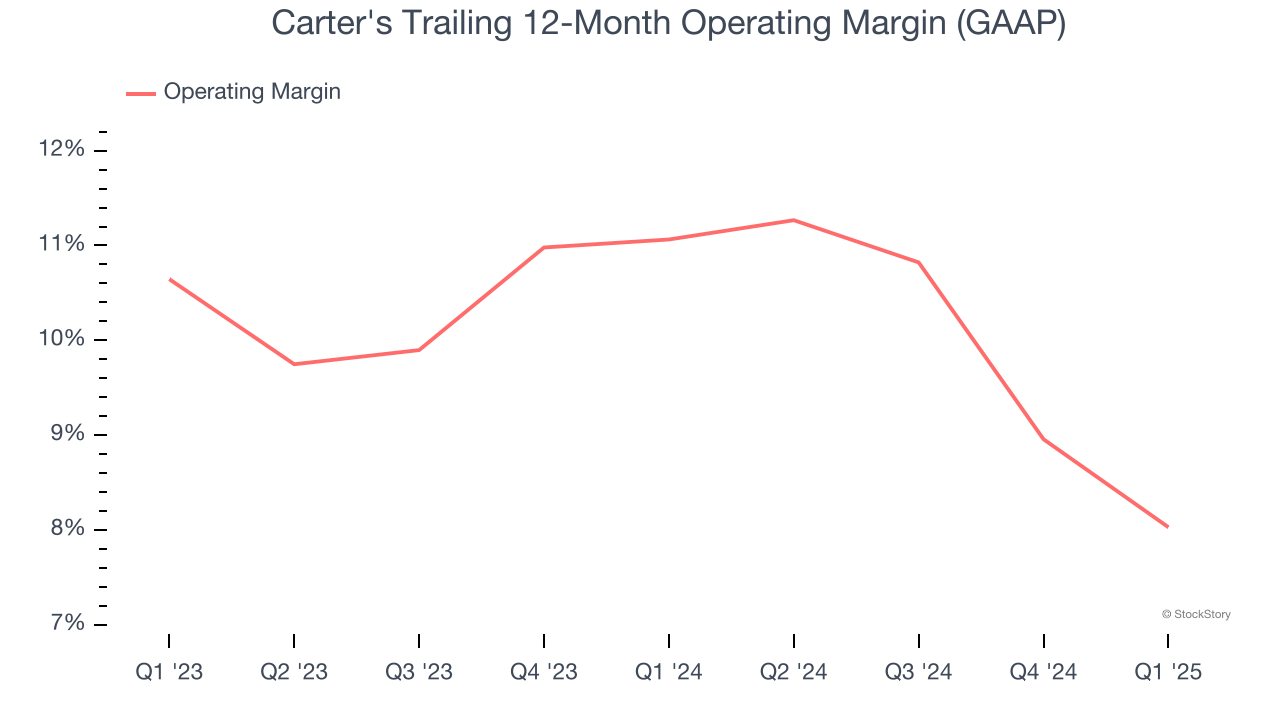
In Q1, Carter's generated an operating profit margin of 4.1%, down 4.2 percentage points year on year. This contraction shows it was less efficient because its expenses increased relative to its revenue.
Earnings Per Share
Revenue trends explain a company’s historical growth, but the long-term change in earnings per share (EPS) points to the profitability of that growth – for example, a company could inflate its sales through excessive spending on advertising and promotions.
Carter’s EPS grew at a weak 2.4% compounded annual growth rate over the last five years. On the bright side, this performance was better than its 3.9% annualized revenue declines and tells us management adapted its cost structure in response to a challenging demand environment.
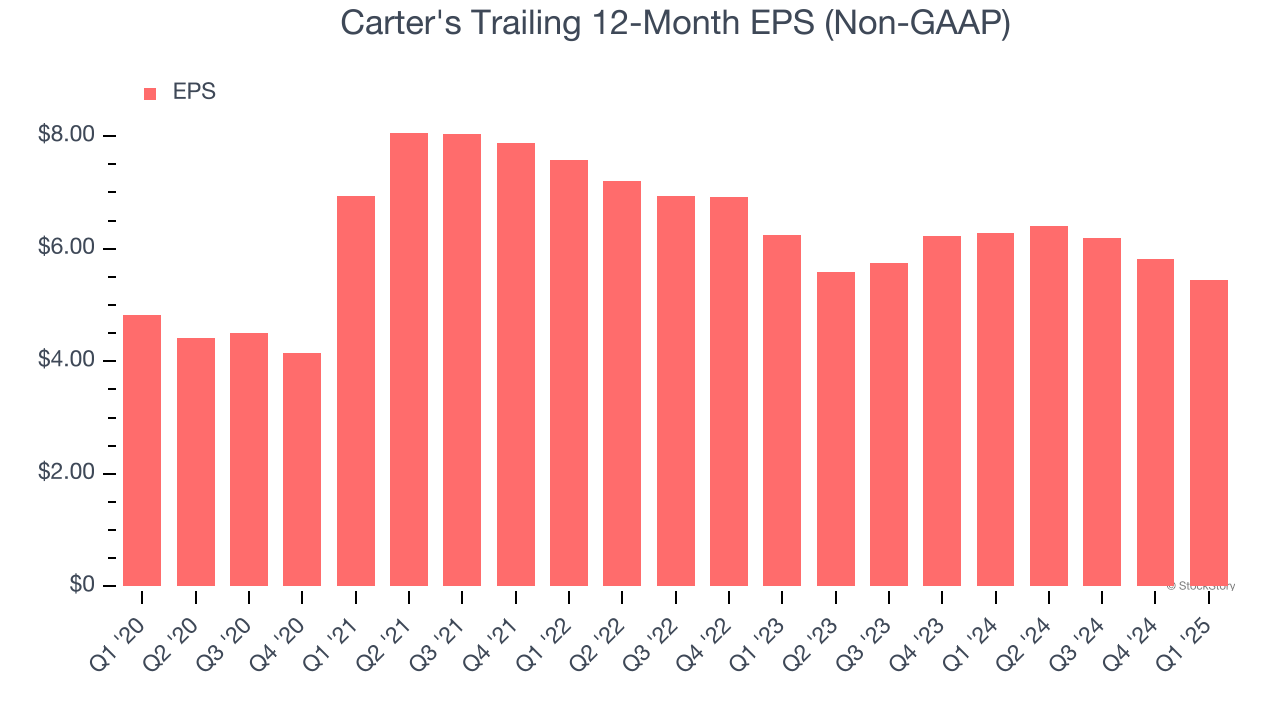
In Q1, Carter's reported EPS at $0.66, down from $1.04 in the same quarter last year. Despite falling year on year, this print easily cleared analysts’ estimates. Over the next 12 months, Wall Street expects Carter’s full-year EPS of $5.44 to shrink by 34.9%.
Key Takeaways from Carter’s Q1 Results
We enjoyed seeing Carter's beat analysts’ EPS expectations this quarter. We were also happy its same-store sales narrowly outperformed Wall Street’s estimates. What's driving shares down, though, is the company's suspension of "forward guidance in light of CEO transition and tariff uncertainty". The stock traded down 3.2% to $36.99 immediately following the results.
Is Carter's an attractive investment opportunity at the current price? If you’re making that decision, you should consider the bigger picture of valuation, business qualities, as well as the latest earnings. We cover that in our actionable full research report which you can read here, it’s free.