
The copper market's been one of those setups where you can feel the tension building under the surface lately—prices have pulled back from those crazy January highs around $6.58. Still, since falling to $5.24, prices have held tough, slightly above the halfway point back to the January highs of $5.91 at $6.00, with decent volume from both specs and commercials. Fundamentals are still screaming long-term tightness thanks to chronic underinvestment in new mines and all the electrification tailwinds from data centers and EVs, but near-term it's anybody's guess as China's demand has been patchy and inventories are doing their usual dance. Novice traders might see it as just another red metal chart. Still, professional traders know this is classic macro-driven volatility where a single data point or policy whisper can swing the whole tape.
One macro event that could light a fire under copper in the next couple months is a stealth acceleration in Beijing's "new quality productive forces" push—imagine targeted, under-the-radar subsidies for massive grid upgrades and AI hardware clusters that aren't getting the usual fanfare in the Western press, quietly pulling forward a wall of physical buying from the biggest consumer on the planet before summer hits. On the bearish flip, watch for a hawkish surprise from the Fed if core inflation refuses to cool, which could slam the brakes on US industrial capex and send the dollar ripping higher, choking off global risk appetite and leaving copper exposed to a swift demand fade. Either of these could absolutely play out, and that's the thing—copper feels like it's sitting right at a crossroads where the current trend could reverse hard, so whether you're scalping futures or stacking longer-term positions, keep your risk tight because the next big move probably won't telegraph itself.
Technical Picture
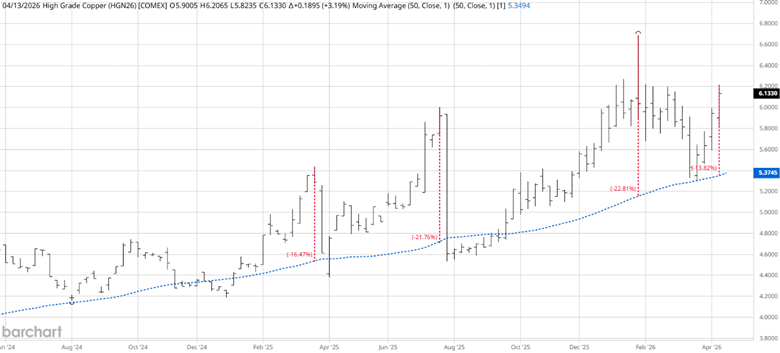
Source: Barchart
The weekly July copper chart shows how consistently the copper market has tested the upsloping 50-week simple moving average (SMA). I prefer to trade with the trend, and being long for now seems more logical. However, for traders who like to sell extremes in uptrends, the three previous price highs after touching the 50 SMA were approximately 23% apart. Currently, we are trading about 14% above the 50 SMA, only about 9% away from a potential price turn.
Correlation Years
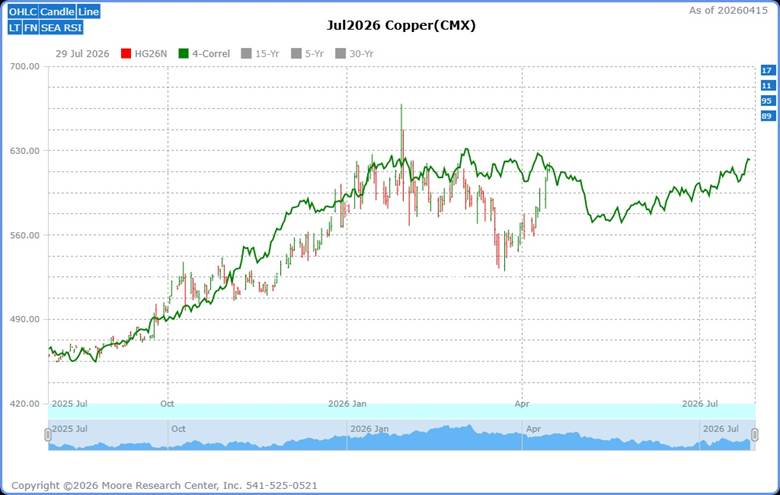
Source: Moore Research Center, Inc. (MRCI)
Currently, the July copper futures contract is highly correlated with these 4-year periods: 1989: 94%; 1995: 90%; 2011: 95%; and 2017: 85%. During the upcoming seasonal sell window, copper prices have historically declined, which helps confirm a countertrend seasonal sell pattern (discussed next).
Seasonal Pattern
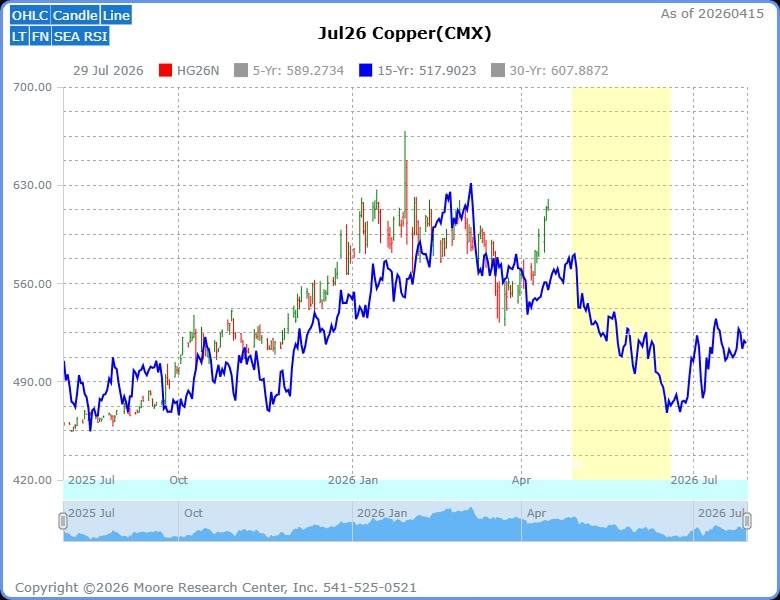
Source: MRCI
The July copper futures contract peaked a little earlier this year than MRCI's 15-year historical pattern (blue line). The price is currently rallying back to retest the January highs. The 15-year pattern reflects this as a normal pattern before prices had met excessive supply, and prices had begun to fall.
MRCI research has identified an optimal seasonal sell window lasting about 53 calendar days (yellow box). By testing the past 15 years of price activity in the July copper futures contract, MRCI has found that prices have closed lower on approximately June 19 than on April 28 for 14 of the past 15 years, a 93% occurrence. During this hypothetical testing period, the average net point profit was 13.56, and the dollar value per one standard-size futures contract was $3,390.
As a crucial reminder, while seasonal patterns can provide valuable insights, they should not be the basis for trading decisions. Traders must consider technical and fundamental indicators, risk management strategies, and market conditions to make informed, balanced trading decisions.
Assets to Trade the Copper Market
Traders can participate using these CME products:
- Standard Copper Futures (HG): Each contract represents 25,000 pounds of copper; each tick (0.0005 per pound) is $12.50 in US dollars. Ideal for institutional and experienced traders.
- Micro Copper Futures (QL): A reduced contract size of 2,500 pounds, with lower margin requirements, making it ideal for retail traders. Each tick (0.0005 per pound) is worth $1.25 per contract.
- Options on Copper Futures: Buy put options to profit from a price fall with limited risk, or sell call options to collect premiums if prices stay flat or fall.
In Closing…
So there you have it—whether you're just getting your feet wet in copper or you've been trading the red metal for years, the setup we just walked through gives you a clear edge: the tension between strong long-term fundamentals and near-term macro crosscurrents, plus the technical, seasonal, and correlation signals all pointing to a potential turning window in the weeks ahead. You now have a practical roadmap that connects the hidden policy moves in China, the Fed's next move, the 50-week SMA behavior, and that reliable 93% seasonal sell window ending mid-June. Use the standard HG contract for size or the micro QL for lower risk. Remember, options can help you define your exposure. The market is sitting right at a crossroads, and the next big leg could deliver real opportunity if you stay flexible, manage your risk, and keep both eyes on the data. Trade smart.
On the date of publication, Don Dawson did not have (either directly or indirectly) positions in any of the securities mentioned in this article. All information and data in this article is solely for informational purposes. For more information please view the Barchart Disclosure Policy here.
More news from Barchart